


MLOps Principles Part One: Model Monitoring

Industry Leader, Financial Services and Consumer, EMEA
Let's start engineering impact together
GlobalLogic provides unique experience and expertise at the intersection of data, design, and engineering.
Get in touchIn this two-part blog series, we’ll explore some of the common problems organisations face when trying to productionise ML models. Namely:
- Why you should monitor your model in production
- What is model bias and how to combat it
- The importance of model explainability when using ML to make impactful decisions
Each blog will define the definitions of these concepts and discuss popular open-source tools to address them.
This blog will explore the various aspects of model monitoring – why you should implement it in your pipeline and the tools available.
Model Monitoring
Model monitoring in production is a critical aspect of MLOps which enables organisations to ensure their deployed models are performing as expected and delivering accurate, reliable results. The ability to monitor models in production is crucial for identifying issues (which we’ll cover below), debugging errors, and enabling fast iteration and improvement.
If a ML model is not properly monitored, it may go unchecked in production and produce incorrect results, become outdated and no longer provide value to the business, or develop subtle bugs over time that go undetected. Unlike traditional software applications, ML systems tend to fail silently as the accuracy of the model degrades over time. For example, an ML model designed to predict house prices before the 2008 financial crises would produce poor quality predictions during the crisis.
In industries where ML plays a central role, failing to catch these types of issues can have serious consequences – for example, in workflows where important decisions are dependent on the model’s outputs. These decisions can have a high impact on customers, especially in regulated industries such as banking.
Types of Model Monitoring
When discussing model monitoring, the initial thought that comes to mind is monitoring the performance of a deployed ML model in production by comparing the predictions made by the model and the ground truth. However, this is only the tip of the iceberg.
Broadly speaking, you can monitor your ML models at two levels:
• Functional level – monitoring input and output data and model evaluation performance.
• Operational level – monitoring the resources used by the deployed model and the pipelines involved in creating the model.
In this blog, we’ll be focusing on functional level monitoring and the potential problems that can be detected and remedied through utilising it.
Typically, a Data Scientist or ML Engineer who is familiar with the deployed model and the underlying datasets used for training is responsible for monitoring at the functional level.
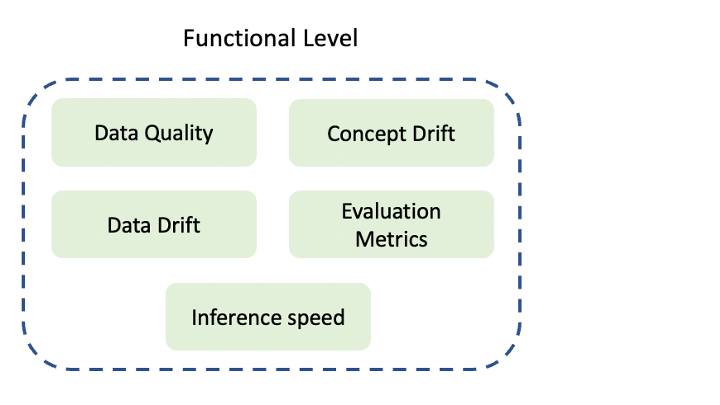
Figure 1 – Types of functional level monitoring
The deterioration of a ML model’s performance over time can be attributed to two main factors: data drift and concept drift. Data drift occurs when the distribution of the input data deviates from the data the model was trained on, resulting in poor quality predictions. It can be detected by monitoring the input data being fed into the model and using statistical tests such as the Kolmogorov–Smirnov test or by using metrics to measure the difference between two distributions.
Concept drift, on the other hand, is a change in the relationship between the target variable and the input data – for example, the sudden surge in online shopping sales during the pandemic lockdowns. Concept drift is detected by continuous monitoring of the model’s performance over-time and the distribution of the model’s prediction confidence scores (only applicable for classification models).
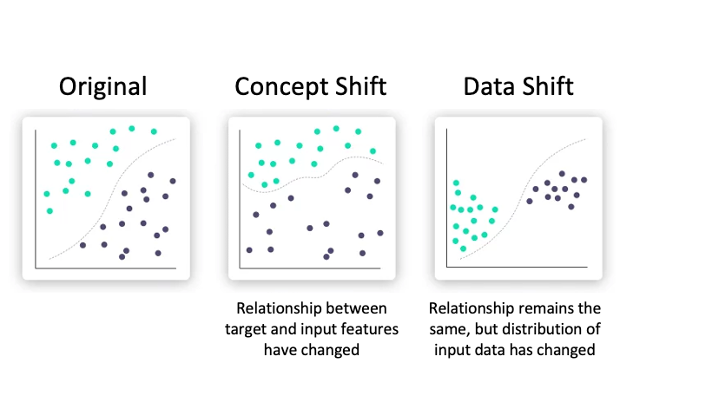
Figure 2 – Illustration of concept and data drift. Original image source: Iguazio
Data quality is another important factor to consider when discussing model performance. Unvalidated data can potentially result in misleading predictions or cause the model to break as unexpected inputs are given to the model. To prevent this, data validation tools can be employed to ensure that the incoming data adheres to a data schema and passes quality checks before going to the model.
Inference speed may also be monitored; this tells us the time it takes for an ML model to make a prediction. Some use-cases may require fast inferencing times due to time-sensitive applications or high-volume requests.
Tooling
There are many tools used available for model monitoring, including those that are exclusive to AWS (SageMaker Model Monitor), Azure (Azure Monitor), and GCP (Vertex AI Model Monitoring). We’ve selected two open-source Python packages which have stood out to us as feature-rich and actively developed – Evidently AI and NannyML.
Evidently AI
Evidently AI evaluates, tests, and monitors the performance of ML models and data quality throughout the ML pipeline. At a high level, there are three core aspects of the package:
1 – Tests are performed on structured data and model quality checks which typically involve comparing a reference and a current dataset. Evidently AI has created several pre-built test suites which contain a set of tests relevant for a particular task. These include data quality, data drift, regression and classification model performance, and other pre-sets.
2 – Interactive reports. These help with visual exploration, debugging, and documentation of the data and model performance. In the same fashion as test suites, Evidently AI has created pre-built reports for specific aspects. If none of the pre-built test suites or reports are suitable for your use case, you are able to build a custom test suit or report. All pre-built suites and reports can be found on their presets documentation page.
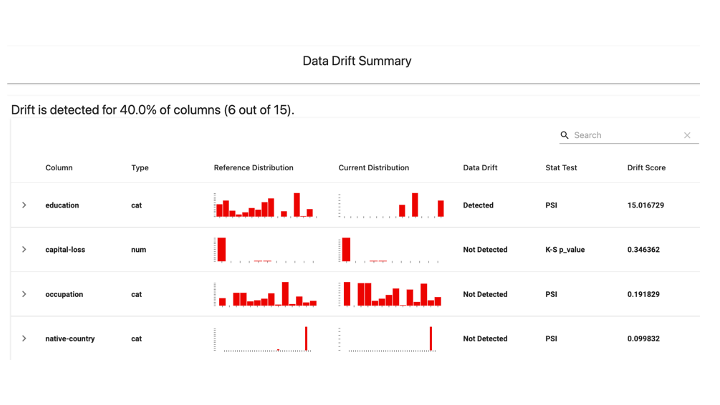
Figure 3 – Example of a data drift report. Image source: Evidently AI
3 – Near-real-time ML monitoring functionality that collects data and model metrics from a deployed ML service. In this aspect, Evidently AI is deployed as a monitoring service that calculates metrics over streaming data and outputs them in the Promethetus format which can then be visualised using a live dashboarding tool such as Grafana – this functionality is in early development and may be subject to major changes.
On top of all this, Evidently AI provides examples of integrating with other tools in the ML pipeline such as Airflow, MLflow, Metaflow, and Grafana.
NannyML
NannyML is a tool that enables you to estimate post-deployment model performance in the absence of ground truth values, detect univariate and multivariate data drift, and link data drift alerts back to changes in model performance. In use-cases where there is a delayed feedback loop (e.g., when estimating delivery ETAs, you’ll need to wait until the delivery has finished to know how accurate the predicted ETA is), this tool can provide immediate feedback on the deployed model’s performance.
Figure 4 – Example of estimated performance of a regression model. Image source: NannyML
Performance estimation of both classification and regression models are supported as the creators of this tool have researched and developed two novel algorithms: confidence-based performance estimation (CBPE) for classification models and direct loss estimation (DLE) for regression models.
While univariate data drift tests (i.e., those only looking at a single input feature) are helpful for monitoring individual features in a dataset, they won’t help when the relationship between two or more input features changes while the underlying data distributions of the individual features remain the same (see figure 5 for an example). In this case, you would need to use a multivariate test to detect data drift. NannyML has developed such a test that involves the use of Principal Component Analysis (PCA), a dimensionality reduction technique.

Figure 5 – Illustration of multivariate shift with univariate distributions on the margins. Image source: NannyML
Conclusion
Model monitoring is an essential aspect of ML development and deployment. By keeping track of model performance and data over time, Data Scientists and ML Engineers can ensure their models continue to make accurate predictions and identify and address any issues that may arise.
Model monitoring helps organisations to make informed decisions, maintain high levels of model performance, and improve the overall customer experience.
Our team here at GlobalLogic UK&I are highly experienced and love working on all things Data Science and MLOps! If you’re interested in working with us, or just want to chat more about these topics in general, feel free to contact Dr Sami Alsindi (Lead Data Scientist) at sami.alsindi@uk.globallogic.com.